2 · Representation
Part I — Probabilistic Reasoning
Big picture
Where this chapter fits
The book is about agents that make good decisions when they are uncertain. Part I (Chapters 2–6) covers the first half of that: reasoning under uncertainty, before any decisions are made. Before an agent can reason about anything, it needs a way to write down what it believes. This chapter supplies that language. Chapter 3 uses it to answer questions, Chapters 4 and 5 learn it from data, and Chapter 6 adds decisions. Every later model on this site, including transition models in Part II and sensor models in Part IV, is built from the pieces introduced here.
The question: how can an agent describe what it believes about many uncertain quantities at once, compactly enough to store and use?
The short answer: a table of probabilities for every combination of many variables is far too large, but if each variable depends directly on only a few others, you can store the same information as small local tables, one per variable, arranged on a graph.
The key ideas at a glance
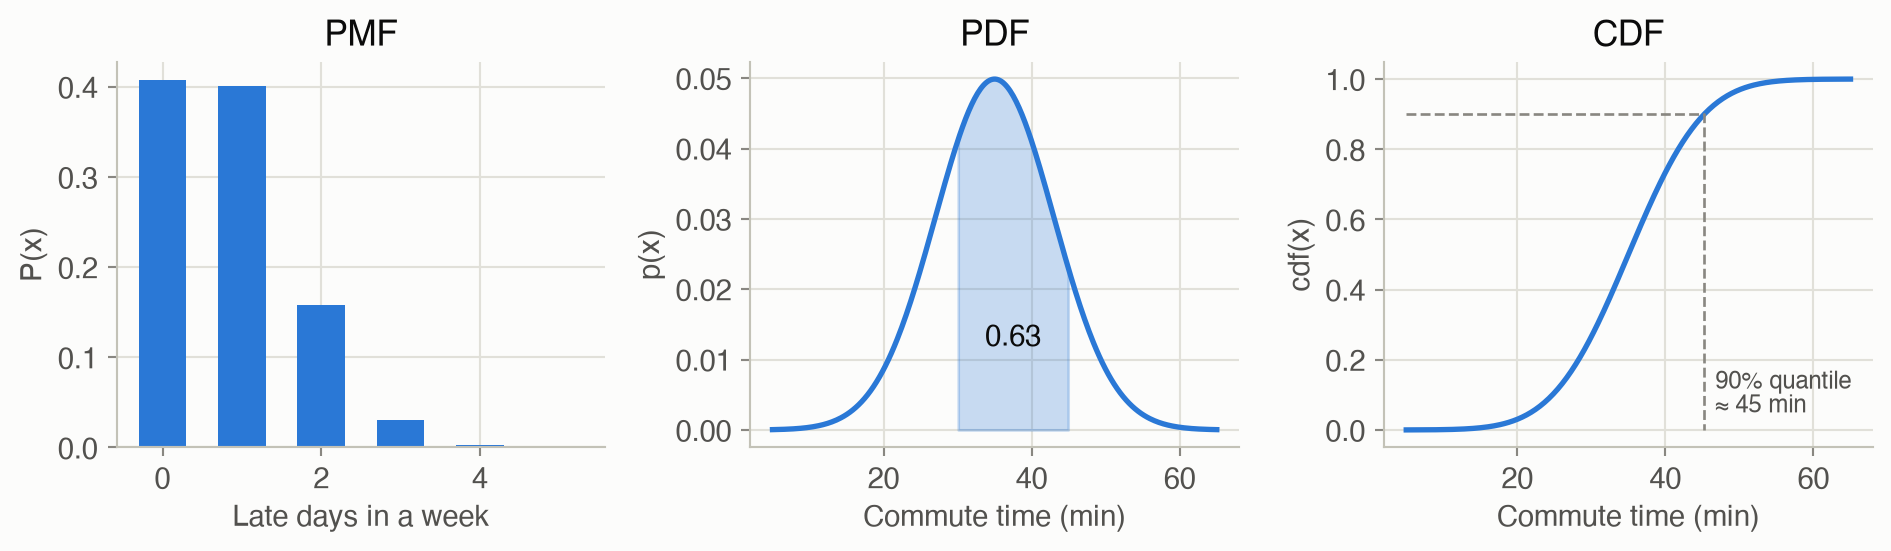
Probability is a degree of belief, and a distribution spreads it over the possible values. For a quantity with separate values, like “number of late days this week”, a probability mass function (PMF) gives each value a probability, and those add up to 1. For a continuous quantity, like “commute time in minutes”, a probability density function (PDF) is a curve, and probabilities are areas under it: the chance of a 30–45 minute trip is the area between 30 and 45. The Gaussian (bell curve) is the standard continuous shape. A mixture of several bell curves handles quantities with several typical values.
A joint distribution describes many variables together, and it explodes. To describe several variables at once, you need a probability for every combination of their values. Five yes/no variables have \(2^5 = 32\) combinations; thirty have about a billion. Such a table can’t be stored, and there would never be enough data to fill it in.
Conditional distributions describe one variable given a few others. \(P(x \mid y)\) is the probability of \(x\) in the situations where \(y\) holds. It is computed as \(P(x, y) / P(y)\). For yes/no variables it’s a small table, a conditional probability table (CPT), such as “late 50% of the time if there’s a jam, 5% if not”. For continuous variables it’s a formula: a straight-line trend plus noise (linear Gaussian), or a smooth on/off switch (sigmoid).
A Bayesian network assembles conditionals into a full joint distribution. Draw a graph with an arrow from each variable to those it directly influences, with no loops. Give each variable one conditional table: its distribution given its parents (the variables pointing into it). Then the probability of any complete situation is the product of one entry from each table. This is the chain rule for Bayesian networks. The commute example needs 10 numbers instead of 31, and the savings grow exponentially with size.
The graph shows which variables can’t inform each other. Two variables are conditionally independent given some observations if learning one tells you nothing more about the other. You can read this off the graph with d-separation. Information flows along paths, a path through an observed middle variable is usually blocked, and one special case works the other way: two causes of a common effect become linked once the effect is observed. That effect is explaining away.
Vocabulary
| Term | Plain meaning |
|---|---|
| Random variable | An uncertain quantity, like “was there a storm?” or “commute time” |
| PMF / PDF | Probability of each value (discrete) / density curve whose areas are probabilities (continuous) |
| CDF, quantile | Chance of at most \(x\) / the value that is beaten a given fraction of the time |
| Joint distribution | Probabilities of every combination of values of several variables |
| Marginal | The distribution of some variables alone, found by summing the joint over the others |
| Conditional, CPT | Distribution of a variable given others; its table form for discrete variables |
| Parent / child | In a Bayesian network, a variable with an arrow into / out of another |
| Chain rule | The joint is the product of each variable’s conditional given its parents |
| Conditional independence | Once \(Z\) is known, learning \(Y\) tells you nothing more about \(X\) |
| d-separation | Reading conditional independence off the graph’s paths |
| Explaining away | Observing a common effect makes its independent causes compete |
After this chapter you can
- Describe an uncertain quantity with a PMF, PDF or mixture, and read probabilities as areas.
- Count how many numbers a full joint table or a Bayesian network needs.
- Build a small Bayesian network and compute the probability of any complete situation by the chain rule.
- Tell from the graph alone whether two variables can inform each other, given what’s observed.
Intuition
TipAnalogy
Imagine describing every possible morning before work. You track five yes/no facts: was there a storm, roadwork, a traffic jam, were you late, and did the radio warn of a storm? Listing a probability for every combination takes \(2^5 = 32\) numbers. With 30 facts it would take about a billion.
But you don’t think that way. You think in local stories: storms and roadwork cause jams; jams make you late; storms trigger radio alerts. Each story needs only a few numbers (“if there’s a jam, I’m late half the time”). Chain the stories together and you can still recover the probability of any full morning, from just 10 numbers.
That “chain the local stories” idea is a Bayesian network. Figure 2 draws the one used throughout this page.
Probabilities as areas
Say your commute time is spread like a bell curve centered at 35 minutes. What’s the chance a trip takes exactly 35.000 minutes? Essentially zero: there are infinitely many possible times. The sensible question is about a range. The chance of 30–45 minutes is the area under the curve between 30 and 45, about 0.63. So the curve’s height (the density) is not itself a probability, and for a narrow curve it can be bigger than 1. Only areas are probabilities. See Equation 1 and Figure 3.
Why a full table explodes
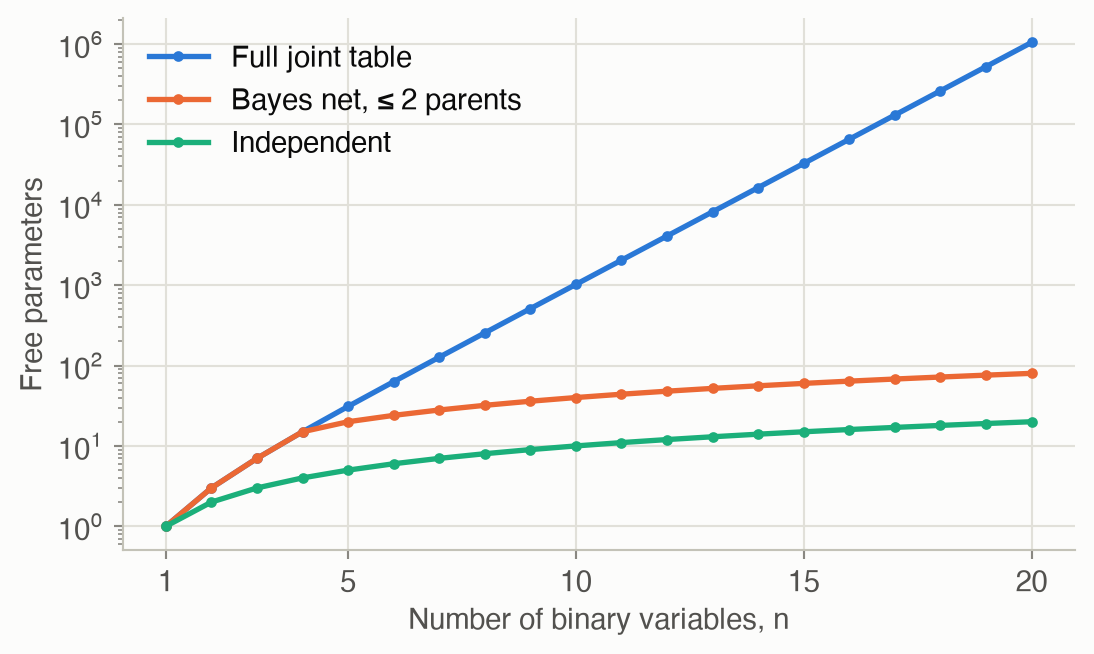
Five yes/no facts give 32 combinations, which is manageable. Each extra fact doubles the count: 10 facts give about a thousand, 20 about a million, 30 about a billion. Even if you could store a billion numbers, you could never observe enough mornings to estimate them. The fix is not a bigger table but a different representation. See Figure 6.
Conditionals as local stories
“If there’s a jam, I’m late half the time; if not, one time in twenty.” That is a conditional distribution: two numbers, \(P(\text{late} \mid \text{jam}) = 0.5\) and \(P(\text{late} \mid \text{no jam}) = 0.05\). It mentions only the jam, because once you know about the jam, the storm and the roadwork don’t change your lateness. Each variable’s story involves only its direct causes, which keeps every story small. See Equation 5.
Multiplying the stories together
How likely is this particular morning: a storm, no roadwork, a jam, late, and a radio alert? Walk through the stories in cause-before-effect order and multiply:
- storm: 0.1;
- no roadwork: 0.8;
- a jam, given storm and no roadwork: 0.7;
- late, given the jam: 0.5;
- an alert, given the storm: 0.95.
The product is 0.027. Every complete morning’s probability comes out this way, so the ten numbers in the stories carry the same information as the 31 in a full table. That’s the chain rule, Equation 8.
Reading independence off the picture
Storms and roadwork have nothing to do with each other: learning there’s roadwork tells you nothing about the weather. But suppose you’re stuck in a jam. Now a storm is a plausible explanation (29% likely). If you then see roadwork, the jam is already explained, and a storm drops to 14%. The two causes became linked because you observed their common effect. The opposite happens on a chain: once you know whether there was a jam, the storm no longer tells you anything about being late. The graph shows which case you’re in. See Figure 7.
Formalism
Probability distributions (one variable)
A probability measures a degree of belief (ADM §2.1): 0 means certainly false, 1 means certainly true. A distribution assigns belief to every value a variable can take (ADM §2.2).
\[ \sum_{x} P(x) = 1 \quad\text{(discrete)} \qquad\qquad \int_{-\infty}^{\infty} p(x)\, dx = 1 \quad\text{(continuous)} \tag{1}\]
In words. For a discrete variable, the probabilities of all values add up to 1. For a continuous one, the density curve encloses an area of 1.
Term by term.
- \(P(x)\) is a probability mass function (PMF): the probability that the variable equals \(x\) exactly.
- \(p(x)\) is a probability density function (PDF). It is not a probability, and it can exceed 1. Probabilities come from areas: \(P(a \le x \le b) = \int_a^b p(x)\, dx\).
- The distinction matters because a continuous variable takes any single exact value with probability 0.
The cumulative distribution function \(\operatorname{cdf}(x) = P(X \le x)\) answers “what’s the chance of at most \(x\)?”. Its inverse, the quantile function, answers “what value is exceeded only \(1 - \alpha\) of the time?”. For example, the 90% quantile of your commute time is the time you beat 9 days out of 10.
The most important continuous distribution:
\[ \mathcal{N}(x \mid \mu, \sigma^2) = \frac{1}{\sigma\sqrt{2\pi}} \exp\!\left(-\frac{(x - \mu)^2}{2\sigma^2}\right) \tag{2}\]
In words. A symmetric bell curve centered at \(\mu\), whose width is set by \(\sigma\).
Term by term.
- \(\mu\) is the mean: the center and the most likely value.
- \(\sigma\) is the standard deviation. About 68% of the probability lies within \(\mu \pm \sigma\), and about 95% within \(\mu \pm 2\sigma\).
- \(\frac{(x-\mu)^2}{2\sigma^2}\) penalizes distance from the mean, measured in units of \(\sigma\). The exponential turns that penalty into a density that falls off fast.
- \(\frac{1}{\sigma\sqrt{2\pi}}\) is just the constant that makes the area equal to 1 (Equation 1).
Two other workhorses are the uniform \(\mathcal{U}(x \mid a, b)\), which is flat on \([a, b]\), and the mixture, for data with several distinct modes:
\[ p(x) = \sum_{i=1}^{n} \rho_i\, \mathcal{N}(x \mid \mu_i, \sigma_i^2), \qquad \rho_i \ge 0,\ \ \sum_i \rho_i = 1 \tag{3}\]
In words. Pick one of \(n\) bell curves at random, with probability \(\rho_i\) for curve \(i\), then draw from it.
Term by term. \(\rho_i\) is the mixture weight, or how common component \(i\) is. The weights sum to 1, so the mixture still integrates to 1. Commute times are a natural example: normal days cluster around 30 minutes, jam days around 50. You can try it in the interactive below.
Figure 3 shows a PMF, a PDF and a CDF side by side.
Joint distributions (many variables)
A joint distribution \(P(x_1, \ldots, x_n)\) gives the probability of every combination of values (ADM §2.3). For \(n\) binary variables, a full table has \(2^n\) entries, and \(2^n - 1\) free parameters, because the last entry is fixed by the rest summing to 1. That exponential growth is the central problem this chapter solves (Figure 6).
For continuous variables, the standard joint distribution is the multivariate Gaussian:
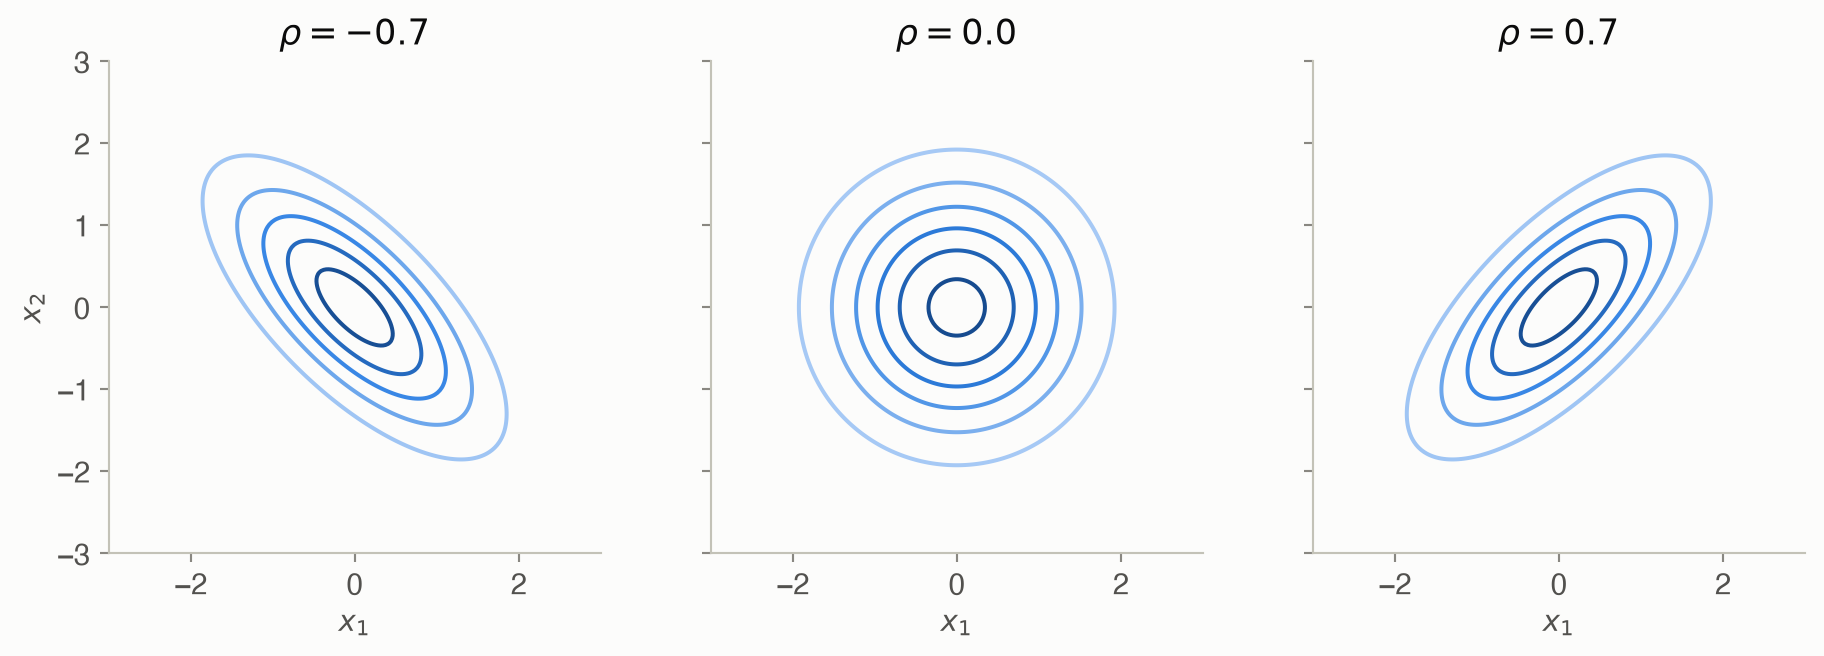
\[ \mathcal{N}(\mathbf{x} \mid \boldsymbol{\mu}, \boldsymbol{\Sigma}) = \frac{1}{(2\pi)^{n/2} |\boldsymbol{\Sigma}|^{1/2}} \exp\!\left(-\tfrac{1}{2} (\mathbf{x} - \boldsymbol{\mu})^\top \boldsymbol{\Sigma}^{-1} (\mathbf{x} - \boldsymbol{\mu})\right) \tag{4}\]
In words. A bell-shaped hill in \(n\) dimensions. The mean \(\boldsymbol{\mu}\) sets where the hill is; the covariance \(\boldsymbol{\Sigma}\) sets its width in each direction and how the variables move together.
Term by term.
- \(\boldsymbol{\Sigma}_{ii}\) is the variance of variable \(i\). \(\boldsymbol{\Sigma}_{ij}\) is the covariance of \(i\) and \(j\): positive if they tend to rise together, negative if one tends to fall as the other rises.
- \((\mathbf{x} - \boldsymbol{\mu})^\top \boldsymbol{\Sigma}^{-1} (\mathbf{x} - \boldsymbol{\mu})\) is a squared distance from the mean that accounts for the variables’ spreads and correlations (the Mahalanobis distance). The contours of equal density are ellipses.
- \(|\boldsymbol{\Sigma}|\), the determinant, measures the overall spread; it keeps the total volume equal to 1.
- The joint needs only \(n\) means and \(n(n+1)/2\) covariances, far fewer than a table, because the Gaussian’s shape is fixed.
Conditional distributions
The way out of the exponential table is to describe each variable given the few things it depends on (ADM §2.4).
\[ P(x \mid y) = \frac{P(x, y)}{P(y)} \tag{5}\]
In words. Among the situations where \(y\) holds, what fraction also have \(x\)?
Term by term. \(P(x, y)\) is how often \(x\) and \(y\) happen together. Dividing by \(P(y)\) zooms in on the world where \(y\) happened, and rescales it so that it sums to 1 again. Rearranged, \(P(x, y) = P(x \mid y)\, P(y)\): a joint can be built from a conditional times a marginal. That identity is the seed of the Bayesian network.
A conditional probability table (CPT) stores \(P(x \mid y)\) for discrete variables: one distribution over \(x\) for each value of the parents \(y\). Continuous variables need a formula instead. Two common ones:
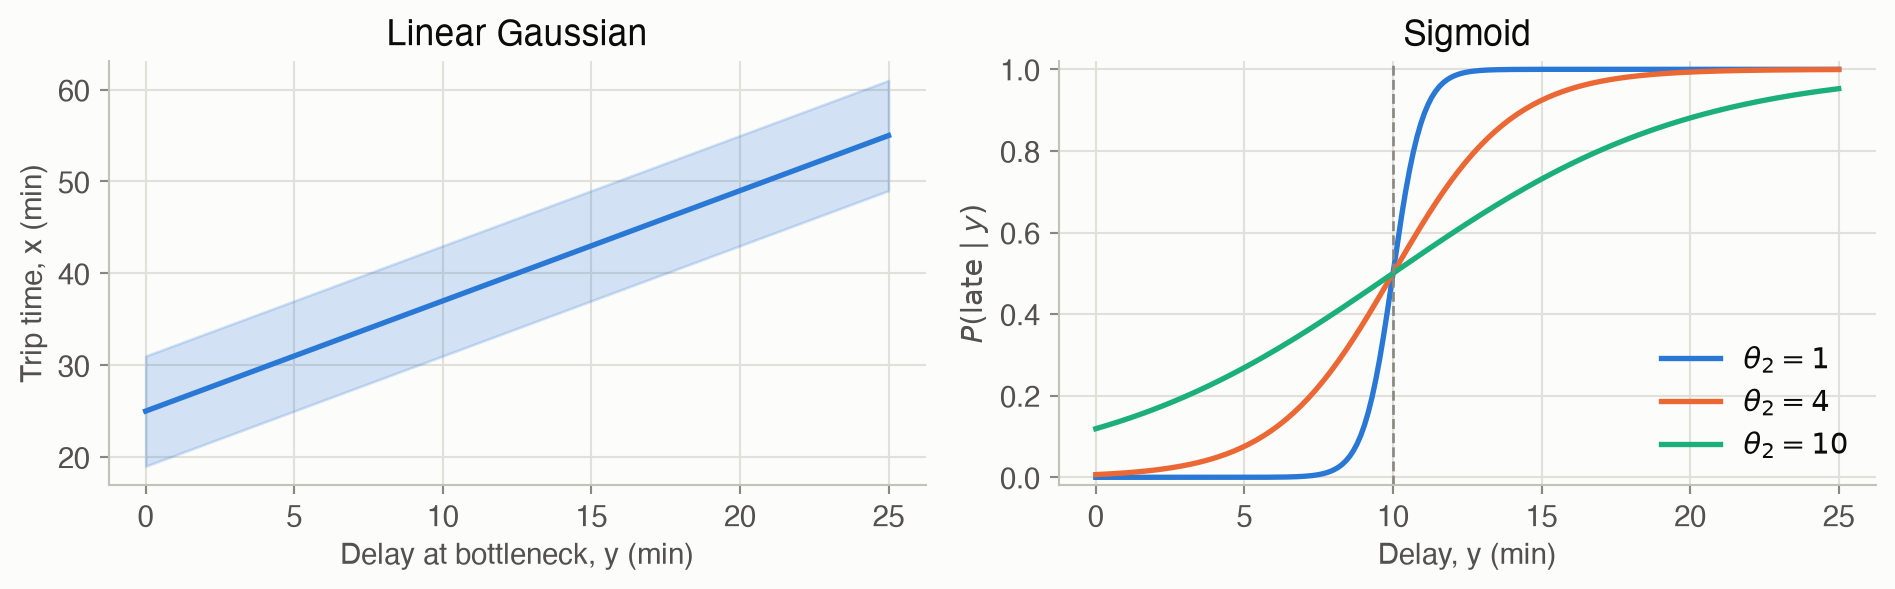
\[ p(x \mid y) = \mathcal{N}(x \mid m y + b,\ \sigma^2) \tag{6}\]
In words. \(x\) is a straight-line function of \(y\), plus bell-shaped noise.
Term by term. \(m\) is the slope (how much \(x\) moves per unit of \(y\)), \(b\) is the intercept, and \(\sigma\) is the noise around the line. For example, trip time might be \(m = 1.2\) minutes per minute of delay, plus a baseline \(b\), plus noise.
\[ P(x^1 \mid y) = \frac{1}{1 + \exp\!\left(-2\,\frac{y - \theta_1}{\theta_2}\right)} \tag{7}\]
In words. A smooth on/off switch. The probability that a binary \(x\) is “yes” rises from 0 to 1 as a continuous \(y\) passes a threshold.
Term by term.
- \(x^1\) means “\(x\) takes value 1”, or yes. \(x^0\) is no.
- \(\theta_1\) is the threshold: at \(y = \theta_1\), the probability is exactly 0.5.
- \(\theta_2\) is the softness. A small \(\theta_2\) gives an abrupt switch, and a large one a gradual ramp.
Bayesian networks
A Bayesian network is a directed acyclic graph with one node per variable, plus one conditional distribution per node given its parents (ADM §2.5). It encodes a joint distribution through one famous identity:
\[ P(x_{1:n}) = \prod_{i=1}^{n} P\big(x_i \mid \mathrm{pa}(x_i)\big) \tag{8}\]
In words. The probability of a complete situation is the product of each variable’s probability given its parents’ values in that situation.
Term by term.
- \(x_{1:n}\) is a full assignment: a value for every variable.
- \(\mathrm{pa}(x_i)\) is the values of \(X_i\)’s parents in the graph.
- Each factor comes straight out of a small CPT.
Why it holds. The general chain rule, which comes from applying Equation 5 repeatedly, says \(P(x_{1:n}) = \prod_i P(x_i \mid x_{1:i-1})\) for any ordering. Order the variables so that parents come before children. The network’s defining assumption is that each variable, given its parents, is independent of the other variables earlier in the order. So each factor shrinks to \(P(x_i \mid \mathrm{pa}(x_i))\).
What it saves. A node with \(k\) binary parents needs \(2^k\) numbers, one \(P(\text{yes})\) per parent combination. The commute network needs \(1 + 1 + 4 + 2 + 2 = 10\) numbers, where the full table needs 31. With 20 variables and at most two parents each, the difference is at most 80 against about a million (Figure 6).
Conditional independence
The graph also tells you, without any arithmetic, when learning one variable can’t change your belief about another (ADM §2.6).
\[ (X \perp Y \mid Z) \iff P(x, y \mid z) = P(x \mid z)\, P(y \mid z) \ \text{ for all } x, y, z \tag{9}\]
In words. Once you know \(Z\), also learning \(Y\) tells you nothing more about \(X\).
Term by term. \(\perp\) reads “is independent of”. The right side says the joint of \(X\) and \(Y\), given \(Z\), splits into separate factors. Equivalently, \(P(x \mid y, z) = P(x \mid z)\).
Whether a path between two variables carries information depends on the middle node of each three-node segment. There are three patterns, shown in Figure 7.
- Chain \(S \to J \to L\): a storm makes a jam likelier, which makes being late likelier. If you already know whether there was a jam, the storm adds nothing about lateness. Observing the middle blocks.
- Fork \(A \leftarrow S \to J\): a radio alert and a jam share a cause. The alert suggests a storm, and so a jam. Once you know whether there was a storm, the alert adds nothing. Observing the middle blocks.
- Collider \(S \to J \leftarrow R\): storms and roadwork are unrelated, until you see a jam. Then learning there was roadwork explains away the jam and makes a storm less likely. Observing the middle, or any of its descendants, opens the path.
\(X\) and \(Y\) are d-separated by \(Z\) if every path between them is blocked somewhere. d-separation guarantees \((X \perp Y \mid Z)\) for every choice of CPTs.
Worked example
The commute network’s tables, in code. (The network also has an entry in the problem gallery, where it can be loaded ready-made.)
from adm.bayes_net import BayesNet

def binary(p_yes):
    """CPT with last axis (no, yes), from P(yes) for each parent combination."""
    p_yes = np.asarray(p_yes, dtype=float)
    return np.stack([1 - p_yes, p_yes], axis=-1)

parents = {"S": (), "R": (), "J": ("S", "R"), "L": ("J",), "A": ("S",)}
commute = BayesNet(
    card={x: 2 for x in parents},
    parents=parents,
    cpt={
        "S": binary(0.1),                     # P(storm)
        "R": binary(0.2),                     # P(roadwork)
        "J": binary([[0.1, 0.6], [0.7, 0.9]]),  # P(jam | S, R); rows S, columns R
        "L": binary([0.05, 0.5]),             # P(late | J)
        "A": binary([0.02, 0.95]),            # P(alert | S)
    },
)
# Values are 1 = no, 2 = yes (Julia counts from 1).
struct BayesNet
card; parents; cpt # Dicts keyed by variable name (a Symbol)
end
# CPT with last axis (no, yes), from P(yes) for each parent combination.
binary(p_yes) = cat(1 .- p_yes, p_yes; dims = ndims(p_yes) + 1)
parents = Dict(:S => (), :R => (), :J => (:S, :R), :L => (:J,), :A => (:S,))
commute = BayesNet(
Dict(x => 2 for x in keys(parents)),
parents,
Dict(:S => binary(0.1), # P(storm)
:R => binary(0.2), # P(roadwork)
:J => binary([0.1 0.6; 0.7 0.9]), # P(jam | S, R); rows S, columns R
:L => binary([0.05, 0.5]), # P(late | J)
:A => binary([0.02, 0.95])), # P(alert | S)
)A full morning, by the chain rule. What’s the probability of a storm, no roadwork, a jam, being late, and a radio alert? By Equation 8, multiply one entry from each table:
\[ P(s^1, r^0, j^1, l^1, a^1) = \underbrace{0.1}_{P(s^1)} \times \underbrace{0.8}_{P(r^0)} \times \underbrace{0.7}_{P(j^1 \mid s^1, r^0)} \times \underbrace{0.5}_{P(l^1 \mid j^1)} \times \underbrace{0.95}_{P(a^1 \mid s^1)} = 0.0266 \]
How often is there a jam? Sum over the four combinations of its parents:
\[ P(j^1) = \sum_{s, r} P(s)\, P(r)\, P(j^1 \mid s, r) = 0.9(0.8)(0.1) + 0.9(0.2)(0.6) + 0.1(0.8)(0.7) + 0.1(0.2)(0.9) = 0.254 \]
Then \(P(l^1) = 0.254 \times 0.5 + 0.746 \times 0.05 = 0.164\): you’re late about one day in six. That number fed the PMF in Figure 3.
Explaining away, in numbers. You’re stuck in a jam. How likely is it that there was a storm?
\[ P(s^1 \mid j^1) = \frac{P(s^1, j^1)}{P(j^1)} = \frac{0.1\,(0.8 \times 0.7 + 0.2 \times 0.9)}{0.254} = \frac{0.074}{0.254} \approx 0.29 \]
Now you also see roadwork. The roadwork alone would explain the jam, so a storm becomes less likely:
\[ P(s^1 \mid j^1, r^1) = \frac{0.1 \times 0.9}{0.1 \times 0.9 + 0.9 \times 0.6} = \frac{0.09}{0.63} \approx 0.14 \]
Storm and roadwork are independent a priori, but dependent once the jam is known. That is the collider pattern at work. Table 2 confirms these numbers from the full joint table.
| Quantity | Value |
|---|---|
| P(s¹, r⁰, j¹, l¹, a¹) | 0.0266 |
| P(j¹) | 0.2540 |
| P(l¹) | 0.1643 |
| P(s¹ | j¹) | 0.2913 |
| P(s¹ | j¹, r¹) | 0.1429 |
| Parameters: network vs full table | 10 vs 31 |
Interactive
Explore independence in the commute network
Pick two variables and any set of observed ones. The explorer reports whether the two are independent, and if not, it highlights an active trail that carries information between them. Observed variables are shaded, as in Figure 7. Try Storm vs. Roadwork with nothing observed, then observe Late.
Mix two commute-time distributions
Commute time is a mixture (Equation 3) of normal days, \(\mathcal{N}(30, 4^2)\), and jam days, \(\mathcal{N}(50, 8^2)\). The slider sets the weight on jam days. It starts at the network’s value, \(P(j^1) = 0.254\).
Algorithms & code
Chain rule, joint table, and parameter count
These implement Equation 8. joint_table applies it to every assignment, which is fine for 5 variables and hopeless for 50. Chapter 3 is about avoiding exactly that.
def probability(bn: BayesNet, assignment: dict) -> float:
    """P(assignment) by the chain rule: one CPT entry per variable."""
    p = 1.0
    for x, pa in bn.parents.items():
        # CPT axes are (parents..., x), so index with the parents' values
        # first and x's own value last.
        index = tuple(assignment[q] for q in pa) + (assignment[x],)
        p *= bn.cpt[x][index]
    return p

def joint_table(bn: BayesNet) -> np.ndarray:
    """The full joint distribution as an array, axes in `bn.parents` order."""
    names = list(bn.parents)
    table = np.zeros([bn.card[x] for x in names])
    for values in product(*(range(bn.card[x]) for x in names)):
        table[values] = probability(bn, dict(zip(names, values)))
    return table

def num_parameters(bn: BayesNet) -> int:
    """Independent numbers in all the CPTs (each row loses one: it sums to 1)."""
    return sum(
        prod(bn.card[q] for q in pa) * (bn.card[x] - 1)
        for x, pa in bn.parents.items()
    )
# P(assignment) by the chain rule: one CPT entry per variable.
# `...` splats the parents' values into separate indices; x's own value comes last.
probability(bn, a) = prod(bn.cpt[x][(a[q] for q in pa)..., a[x]] for (x, pa) in bn.parents)
# The full joint distribution as an array, with axes in the given order.
function joint_table(bn, order)
table = zeros(Tuple(bn.card[x] for x in order))
for idx in CartesianIndices(table)
table[idx] = probability(bn, Dict(zip(order, Tuple(idx))))
end
return table
end
# Independent numbers in all the CPTs (each row loses one: it sums to 1).
num_parameters(bn) = sum(prod((bn.card[q] for q in pa); init = 1) * (bn.card[x] - 1)
for (x, pa) in bn.parents)d-separation by searching for an active trail
The search walks the graph from \(X\), keeping track of whether it arrived at each node from a child (“up”) or from a parent (“down”). That direction is what decides whether a node is a chain, fork or collider on the current path. If it ever reaches \(Y\), the path it followed is an active trail.
def active_trail(parents: dict, x: str, y: str, given=()) -> list | None:
    """An active trail from x to y given the observed set, or None if none.

    Searches (node, direction) pairs: "up" means we arrived from a child,
    "down" means we arrived from a parent. A trail through a node is blocked
    if the node is observed, except at a v-structure (collider), which is
    active only if the collider or one of its descendants is observed.
    """
    given = set(given)
    children = {v: [c for c in parents if v in parents[c]] for v in parents}
    # A collider is active if it or a descendant is observed, i.e. if it is
    # an ancestor of (or in) the observed set.
    active_colliders, frontier = set(), list(given)
    while frontier:
        v = frontier.pop()
        if v not in active_colliders:
            active_colliders.add(v)
            frontier.extend(parents[v])
    came_from = {(x, "up"): None}
    queue = [(x, "up")]
    while queue:
        node, direction = state = queue.pop(0)
        if node == y and node not in given:
            trail = []
            while state is not None:
                trail.append(state[0])
                state = came_from[state]
            return trail[::-1]
        moves = []
        if direction == "up" and node not in given:
            moves += [(p, "up") for p in parents[node]]
            moves += [(c, "down") for c in children[node]]
        elif direction == "down":
            if node not in given:
                moves += [(c, "down") for c in children[node]]
            if node in active_colliders:
                moves += [(p, "up") for p in parents[node]]
        for move in moves:
            if move not in came_from:
                came_from[move] = state
                queue.append(move)
    return None

def d_separated(parents: dict, x: str, y: str, given=()) -> bool:
    """True if x and y are conditionally independent given `given`."""
    return active_trail(parents, x, y, given) is None
function active_trail(parents, x, y, given = ())
given = Set(given)
children = Dict(v => [c for c in keys(parents) if v in parents[c]] for v in keys(parents))
# A collider is active if it or a descendant is observed.
active_colliders, frontier = Set{Symbol}(), collect(given)
while !isempty(frontier)
v = pop!(frontier)
v in active_colliders && continue
push!(active_colliders, v)
append!(frontier, parents[v])
end
came_from = Dict{Tuple{Symbol, Symbol}, Any}((x, :up) => nothing)
queue = [(x, :up)]
while !isempty(queue)
state = popfirst!(queue)
node, direction = state
if node == y && !(node in given)
trail = Symbol[]
while state !== nothing
push!(trail, state[1])
state = came_from[state]
end
return reverse(trail)
end
moves = Tuple{Symbol, Symbol}[]
if direction == :up && !(node in given)
append!(moves, [(p, :up) for p in parents[node]], [(c, :down) for c in children[node]])
elseif direction == :down
node in given || append!(moves, [(c, :down) for c in children[node]])
node in active_colliders && append!(moves, [(p, :up) for p in parents[node]])
end
for m in moves
haskey(came_from, m) || (came_from[m] = state; push!(queue, m))
end
end
return nothing
end
d_separated(parents, x, y, given = ()) = active_trail(parents, x, y, given) === nothingRun them on the commute network
p_morning = probability(commute, {"S": 1, "R": 0, "J": 1, "L": 1, "A": 1})
n_params = num_parameters(commute)
storm_roadwork = d_separated(parents, "S", "R")
storm_roadwork_given_late = d_separated(parents, "S", "R", ["L"])
trail = active_trail(parents, "A", "L")
p_morning = probability(commute, Dict(:S => 2, :R => 1, :J => 2, :L => 2, :A => 2))
@assert p_morning ≈ 0.1 * 0.8 * 0.7 * 0.5 * 0.95
@assert num_parameters(commute) == 10
joint = joint_table(commute, [:S, :R, :J, :L, :A])
@assert sum(joint) ≈ 1 && sum(joint[:, :, :, 2, :]) ≈ 0.1643
@assert d_separated(parents, :S, :R) && !d_separated(parents, :S, :R, (:L,))
@assert active_trail(parents, :A, :L) == [:A, :S, :J, :L]P(storm, no roadwork, jam, late, alert) = 0.0266
Parameters: 10 in the network vs 31 in a full table
Storm ⊥ Roadwork: True; Storm ⊥ Roadwork | Late: False
Active trail from Radio alert to Late: A → S → J → L
NoteReading the Julia code (for Python programmers)
- Symbols like
:Sare lightweight names, a common choice for dictionary keys. They’re like interned strings. cat(a, b; dims = k)stacks arrays along a new axisk, likenp.stack([a, b], axis=-1)here.- Splatting:
bn.cpt[x][(a[q] for q in pa)..., a[x]]expands the parents’ values into separate indices, liketable[(*parent_values, x_value)]in Python. CartesianIndices(table)loops over every index tuple of an array, likeitertools.product(*map(range, table.shape)).prod(...; init = 1)gives 1 for an empty product, which is needed for a node with no parents. Python’smath.proddoes that automatically.
Solved problems
Problem 1: counting parameters. A network has six binary variables. \(A\) and \(B\) have no parents; \(C\) has parents \(A, B\); \(D\) has parent \(C\); \(E\) has parents \(C, D\); \(F\) has parents \(B, E\). How many free parameters does it need, and how many would a full joint table need?
TipSolution
Each binary node needs \(2^{k}\) numbers, where \(k\) is its number of parents: \(A\): 1, \(B\): 1, \(C\): 4, \(D\): 2, \(E\): 4, \(F\): 4. The total is 16. A full table needs $2^6 - 1 = $ 63.
Problem 2: reading independence off the graph. In the commute network, decide each of the following, and name the blocking or active pattern: (a) \(A \perp R\); (b) \(A \perp R \mid J\); (c) \(A \perp L \mid S\); (d) \(S \perp R \mid L\).
TipSolution
Independent. The only path is \(A \leftarrow S \to J \leftarrow R\), and the collider \(J\) is unobserved (as is its descendant \(L\)), so it blocks.
Dependent. Observing \(J\) opens the collider. The fork at \(S\) is unobserved, so it passes, and the trail \(A - S - J - R\) is active.
Independent. The path \(A \leftarrow S \to J \to L\) has a fork at \(S\), which is observed and so blocks.
Dependent. \(L\) is a descendant of the collider \(J\). Observing it opens \(S \to J \leftarrow R\). Intuitively, being late suggests a jam, which then needs an explanation.
Check them all in the explorer above.
Problem 3: a Gaussian probability. Commute time is \(\mathcal{N}(35, 8^2)\) minutes. Using the rule of thumb that about 95% of the probability lies within \(2\sigma\) of the mean, what range covers 95% of commutes? About what fraction of commutes take longer than 51 minutes?
TipSolution
\(35 \pm 2 \times 8\) gives 19 to 51 minutes. The remaining 5% is split evenly between the two tails, so about 2.5% of commutes take longer than 51 minutes. (The exact value is 2.3%.)
Problem 4: explaining away, from scratch. Change the commute network so that roadwork is common, \(P(r^1) = 0.5\), and keep everything else. Compute \(P(s^1 \mid j^1)\). Is it higher or lower than the original 0.29, and why?
TipSolution
\(P(s^1, j^1) = 0.1\,(0.5 \times 0.7 + 0.5 \times 0.9) = 0.08\), and \(P(s^0, j^1) = 0.9\,(0.5 \times 0.1 + 0.5 \times 0.6) = 0.315\). So \(P(s^1 \mid j^1) = 0.08 / 0.395 \approx\) 0.20, which is lower than 0.29. With roadwork common, a jam is more easily explained without a storm, so seeing a jam is weaker evidence for one. This is explaining away again, now working through the prior on the competing cause.
Recap
- Distributions describe belief about one quantity: a PMF for discrete values, a PDF for continuous ones, with probabilities as areas (Equation 1). The Gaussian (Equation 2) and mixtures (Equation 3) are the everyday building blocks. Why it matters: every model later in the book, whether transitions, observations or rewards, is built from these pieces.
- Joint distributions over many variables grow exponentially: \(2^n - 1\) numbers for \(n\) binary variables. Why it matters: this is the core obstacle to reasoning about realistic systems, and every representation afterward is a way around it.
- Conditional distributions describe one variable given a few others: tables, linear Gaussians (Equation 6), sigmoids (Equation 7). Why it matters: they are the “local stories” that stay small, and they reappear as transition models \(T(s' \mid s, a)\) in Ch 7 and observation models \(O(o \mid a, s')\) in Ch 19.
- A Bayesian network multiplies those local stories into a full joint (Equation 8), with far fewer parameters. Why it matters: it is the representation that Ch 3 (inference), Ch 4 (learning parameters) and Ch 5 (learning structure) all work on, and decision networks in Ch 6 extend it.
- The graph reveals independence through d-separation: chains and forks are blocked by observing the middle; colliders are opened by it. Why it matters: independence is what makes inference and learning tractable, and explaining away is a real, often counterintuitive effect in diagnosis.
Cheat sheet & connections
| Name | Formula | Ref |
|---|---|---|
| Normalization | \(\sum_x P(x) = 1\), \(\ \int p(x)\,dx = 1\) | Equation 1 |
| ★ Gaussian | \(\mathcal{N}(x \mid \mu, \sigma^2) = \frac{1}{\sigma\sqrt{2\pi}} e^{-(x-\mu)^2 / 2\sigma^2}\) | Equation 2 |
| Mixture | \(p(x) = \sum_i \rho_i \mathcal{N}(x \mid \mu_i, \sigma_i^2)\) | Equation 3 |
| ★ Multivariate Gaussian | \(\mathcal{N}(\mathbf{x} \mid \boldsymbol\mu, \boldsymbol\Sigma)\), with elliptical contours | Equation 4 |
| ★ Conditional probability | \(P(x \mid y) = P(x, y) / P(y)\) | Equation 5 |
| Linear Gaussian | \(p(x \mid y) = \mathcal{N}(x \mid my + b, \sigma^2)\) | Equation 6 |
| Sigmoid | \(P(x^1 \mid y) = 1 / (1 + e^{-2(y - \theta_1)/\theta_2})\) | Equation 7 |
| ★ Chain rule (Bayes net) | \(P(x_{1:n}) = \prod_i P(x_i \mid \mathrm{pa}(x_i))\) | Equation 8 |
| Conditional independence | \(P(x, y \mid z) = P(x \mid z) P(y \mid z)\) | Equation 9 |
d-separation in one line: a path is blocked if it has an observed chain or fork node, or an unobserved collider with no observed descendants.
Common pitfalls
- Treating a density as a probability. \(p(x) = 2\) is fine for a narrow distribution; only areas are probabilities.
- Forgetting that CPT rows sum to 1. Store \(P(\text{yes})\) and derive \(P(\text{no})\), or check each row.
- Reading arrows as proof of causation. A Bayesian network only encodes independence. Arrows drawn from cause to effect make the tables small and easy to fill in, but the math doesn’t require it.
- Assuming observed evidence can only reduce dependence. Observing a collider or one of its descendants creates dependence (explaining away).
Connections
- Ch 3 · Inference computes queries like \(P(s^1 \mid j^1)\) without building the full joint table.
- Ch 4 · Parameter Learning estimates the CPT numbers from data.
- Ch 5 · Structure Learning learns the graph itself.
- Ch 6 · Simple Decisions adds decision and utility nodes to make decision networks.
- Ch 19 · Beliefs uses the same conditional-distribution building blocks for dynamics and sensors.
- Appendix B · Probability Distributions: the uniform, Gaussian, Beta and Dirichlet families, with plots.